The diagrams were pictures. A map wider than the screen could only be read by scrolling the page, and nothing on it could be moved.
Now they zoom, pan, and you can shove the boxes around.
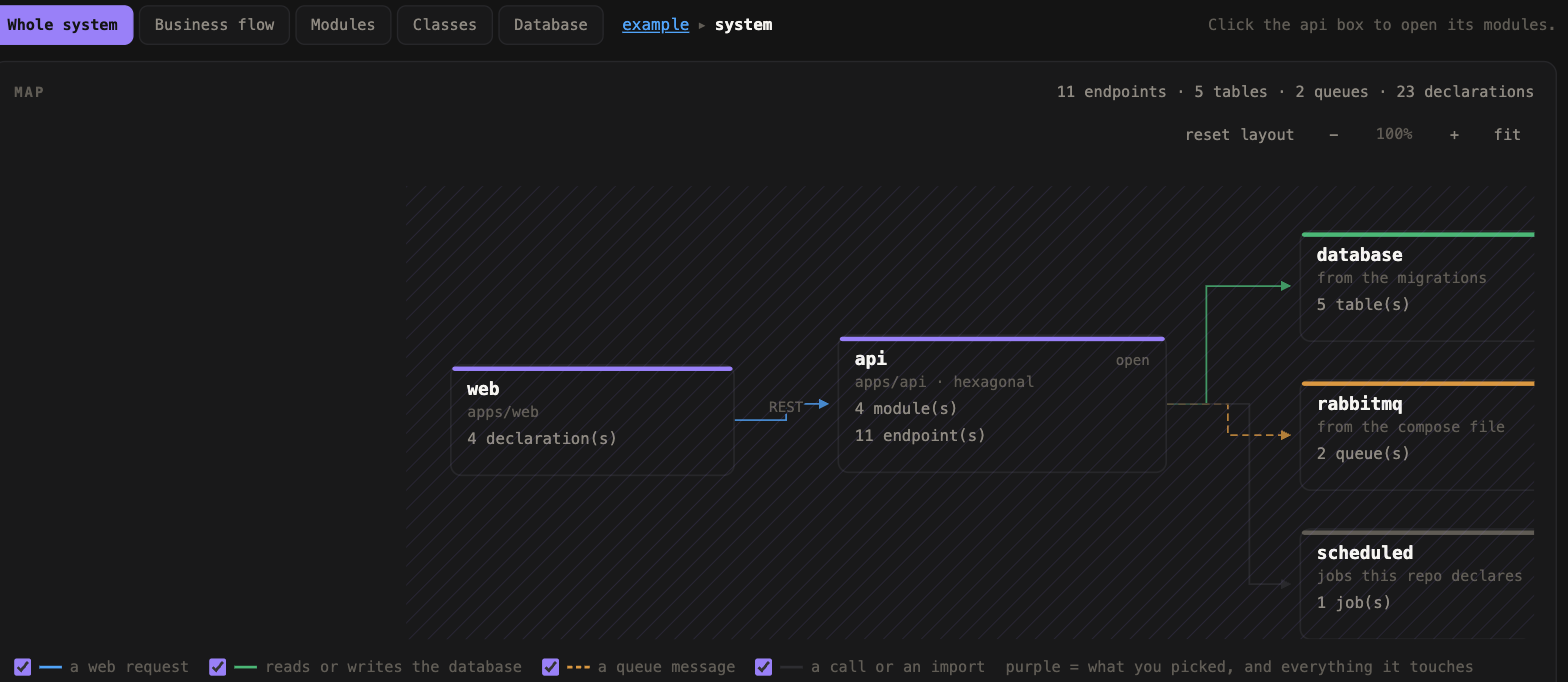
wheel          zoom about the cursor
drag empty     pan
drag a box     move it, edges follow
toolbar        −  100%  +  ·  fit  ·  reset layout
Positions are remembered per project and per view, in that browser's localStorage — beside the theme choice that was already there.
The library I didn't use
The obvious move is React Flow. It's genuinely good at this, and I built it — vendored React, React DOM and React Flow as UMD bundles, wired the map through it, got drag and zoom and a minimap.
Then I looked at it. The nodes came out as plain white boxes: no coloured top bars per kind, no
subtitles, no 4 module(s) · 11 endpoint(s) counts, no per-kind edge colours. Everything that
makes the map readable was gone, because React Flow renders its own node chrome and keel's
drawing is the part that carries the meaning.
Getting it back would have meant rebuilding every node as a custom React component — a lot of work to arrive where the SVG already was. So it got reverted, entirely.
The thing that made the feature worth having was the drawing, not the interaction. The interaction is a layer on top.
What it is instead
About 280 lines of vanilla JavaScript, no dependencies, no build step.
The SVG already had a viewBox, which is the ideal substrate: pan and zoom are one transform on
a wrapping <g>. The only real work was making edges follow a box you drag.
Every node now carries its geometry, and every edge its endpoints:
<g data-node="app:api" data-x="660" data-y="288" data-w="196" data-h="84">
<path data-from="app:web" data-to="app:api" data-bend="0.5" d="...">
That's everything the browser needs to re-route without asking the server again.
Keeping the two routers honest
The server computes edge paths with an elbow() function. When you drag a box, the browser has
to produce a path that looks like it came from the same place — so elbow() is ported to the
browser, and the port is re-run for the edges that moved.
Only the ones that moved. An untouched diagram keeps byte-for-byte the paths the server drew, and
reset layout restores the original rather than recomputing it — the original is stashed the
first time a diagram becomes interactive.
Two implementations of one routing rule is a real cost, and it's called out in a comment at both ends. The alternative was approximating, which would have made a dragged edge visibly not belong.
Two bugs that only the browser could find
I'd have shipped both if I'd only read the code.
The fit ran before layout. It measured the container in the same tick the height was set, got a box that didn't exist yet, and every graph opened off-screen. Fixed by deferring to two animation frames — the first only guarantees the style is applied.
A regex died inside a template literal. The whole page is built in a JS template string, and
\s in a template literal loses its backslash — so /\s+/ became /s+/, matching the letter
s. The viewBox never parsed, so every graph fitted itself to a phantom 100×100 box.
Neither shows up in review. Both were obvious within seconds of opening the page and reading the actual transform out of the DOM.
keel is a Claude Code plugin. github.com/MiladNalbandi/keel